The table given below shows a record of the weight in kilogram of 200 students of a school.
| Weight(kg) | Number of students |
|---|---|
| 40 - 45 | 8 |
| 45 - 50 | 19 |
| 50 - 55 | 24 |
| 55 - 60 | 45 |
| 60 - 65 | 51 |
| 65 - 70 | 31 |
| 70 - 75 | 22 |
Draw a histogram and find the modal weight.
[Take 2 cm = 5 kg along one axis and 2 cm = 5 students along the other axis]
Show SolutionHide Solution↓
Steps of Construction:
Draw a histogram of the given distribution.
Inside the highest rectangle, which represents the maximum frequency (the modal class 60-65), draw two lines AC and BD diagonally from the upper corners C and D of the adjacent rectangles (50-55 and 65-70) to the top corners of the modal rectangle.
Through the point K (the point of intersection of diagonals AC and BD), draw KL perpendicular to the horizontal axis.
The value of point L on the horizontal axis represents the value of the mode.
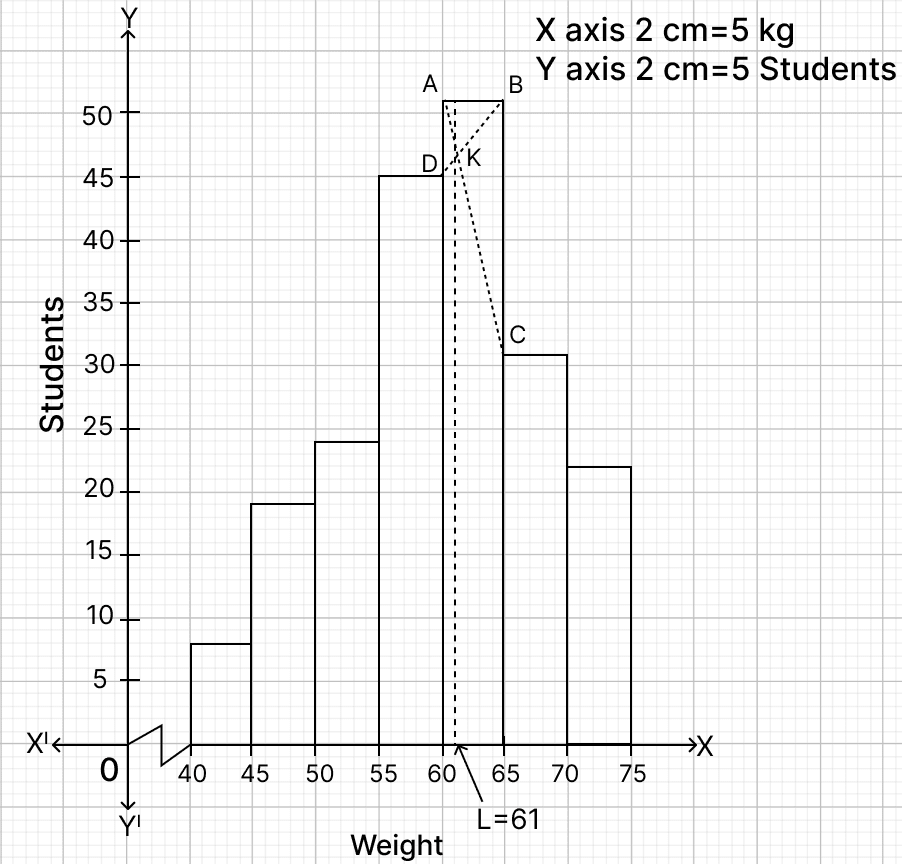
From graph,
L = 61.
Hence, modal weight = 61 kg.