The marks of 200 students in a test were recorded as follows :
| Marks % | No. of students |
|---|---|
| 0-10 | 5 |
| 10-20 | 7 |
| 20-30 | 11 |
| 30-40 | 20 |
| 40-50 | 40 |
| 50-60 | 52 |
| 60-70 | 36 |
| 70-80 | 15 |
| 80-90 | 9 |
| 90-100 | 5 |
Using graph sheet draw ogive for the given data and use it to find the,
(a) median
(b) number of students who obtained more than 65% marks
(c) number of students who did not pass, if the pass percentage was 35.
Show SolutionHide Solution↓
| Marks % | No. of students (f) | CF |
|---|---|---|
| 0-10 | 5 | 5 |
| 10-20 | 7 | 12 |
| 20-30 | 11 | 23 |
| 30-40 | 20 | 43 |
| 40-50 | 40 | 83 |
| 50-60 | 52 | 135 |
| 60-70 | 36 | 171 |
| 70-80 | 15 | 186 |
| 80-90 | 9 | 195 |
| 90-100 | 5 | 200 |
Steps :
Take 1 cm = 10 marks on x-axis.
Take 1 cm = 20 students on y-axis.
Plot the points (10, 5), (20, 12), (30, 23), (40, 43), (50, 83), (60, 135), (70, 171), (80, 186), (90, 195) and (100, 200).
Join the points by free hand curve.
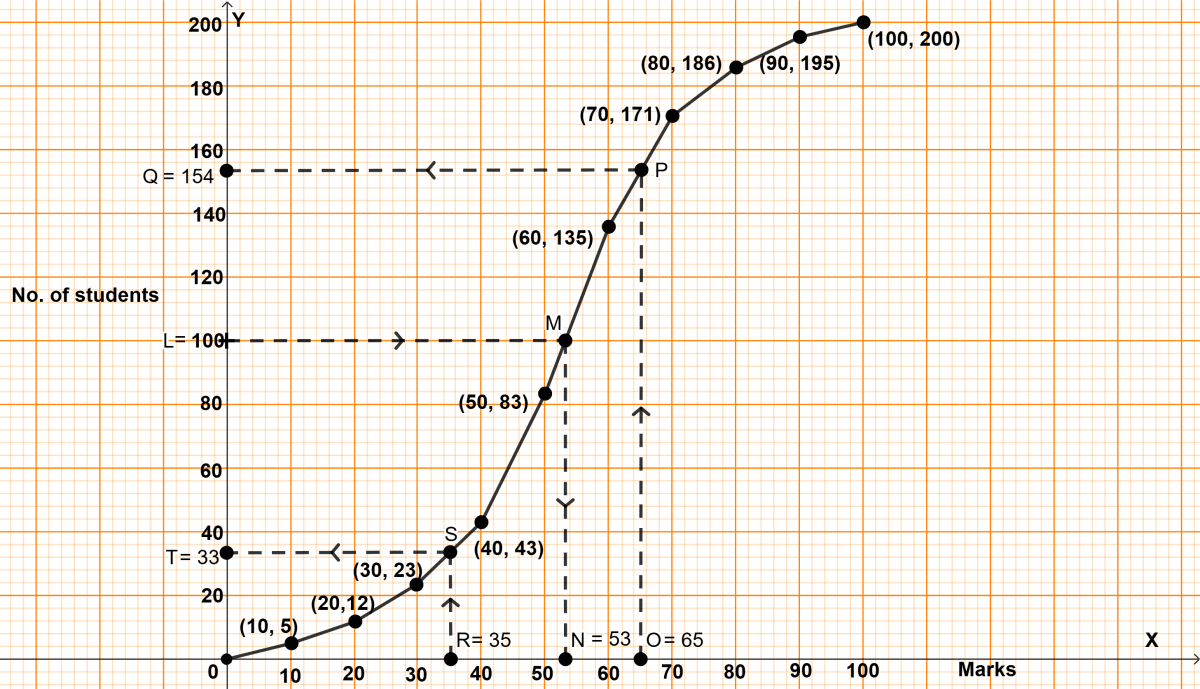
(a) n = 200, which is even
Median = $\frac{n}{2} = \frac{200}{2}$ = 100th term.
Through point L = 100 draw a horizontal line parallel to x-axis touching the graph at point M, through M draw a vertical line parallel to y-axis touching x-axis at point N = 53.
Hence, median = 53.
(b) Total marks = 100
65% of 100 = 65
Through point O = 65 draw a vertical line parallel to y-axis touching the graph at point P, through P draw a horizontal line parallel to x-axis touching y-axis at point Q = 154.
∴ 154 students score less than or equal to 65%.
∴ 46 (200 - 154) students score more than 65%.
Hence, 46 students score more than 65%.
(c) Total marks = 100
35% of 100 = 35
Through point R = 35 draw a vertical line parallel to y-axis touching the graph at point S, through S draw a horizontal line parallel to x-axis touching y-axis at point T = 33.
Hence, 33 students did not pass the exam.