9(b)
The diagram below shows the change of phases of a substance on a temperature vs time graph on heating the substance at a constant rate.
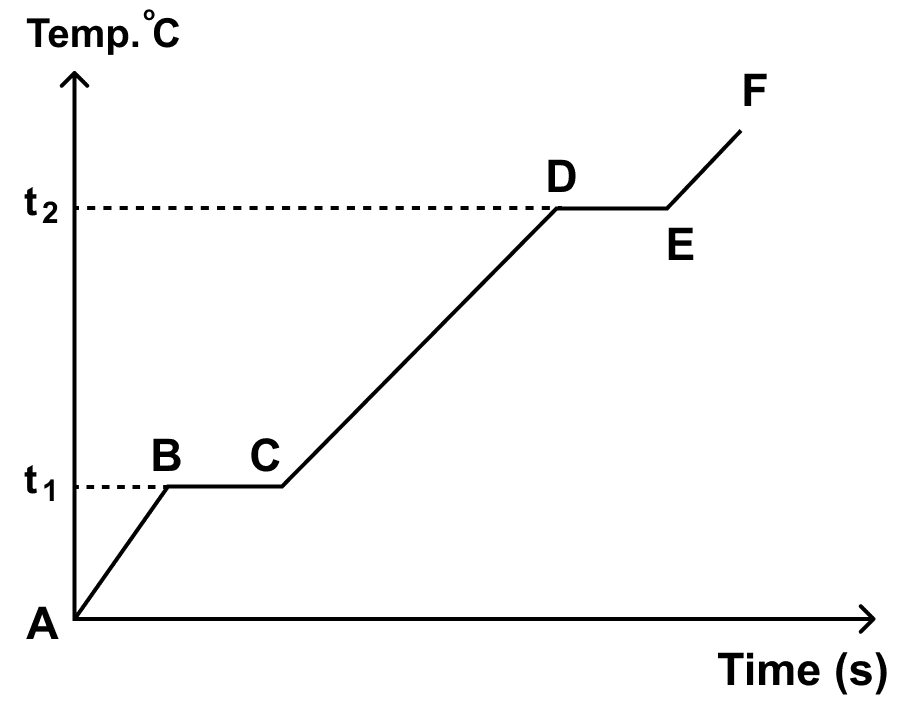
(i) Why is the slope of CD less than slope of AB?
(ii) What is the boiling and melting point of the substance?
Show SolutionHide Solution↓
(i) In part CD, the rate of rise in temperature is slow as the substance in this phase has high specific heat capacity while temperature rises rapidly in part AB (so higher slope) as the substance has lower specific heat capacity in this phase. The different specific heat capacities are attributed to different phases of state (i.e. solid and liquid phase).
(ii) Boiling point of substance is t2 and melting point of substance is t1