The graph given below shows the change in temperature with time, when a substance is cooled.
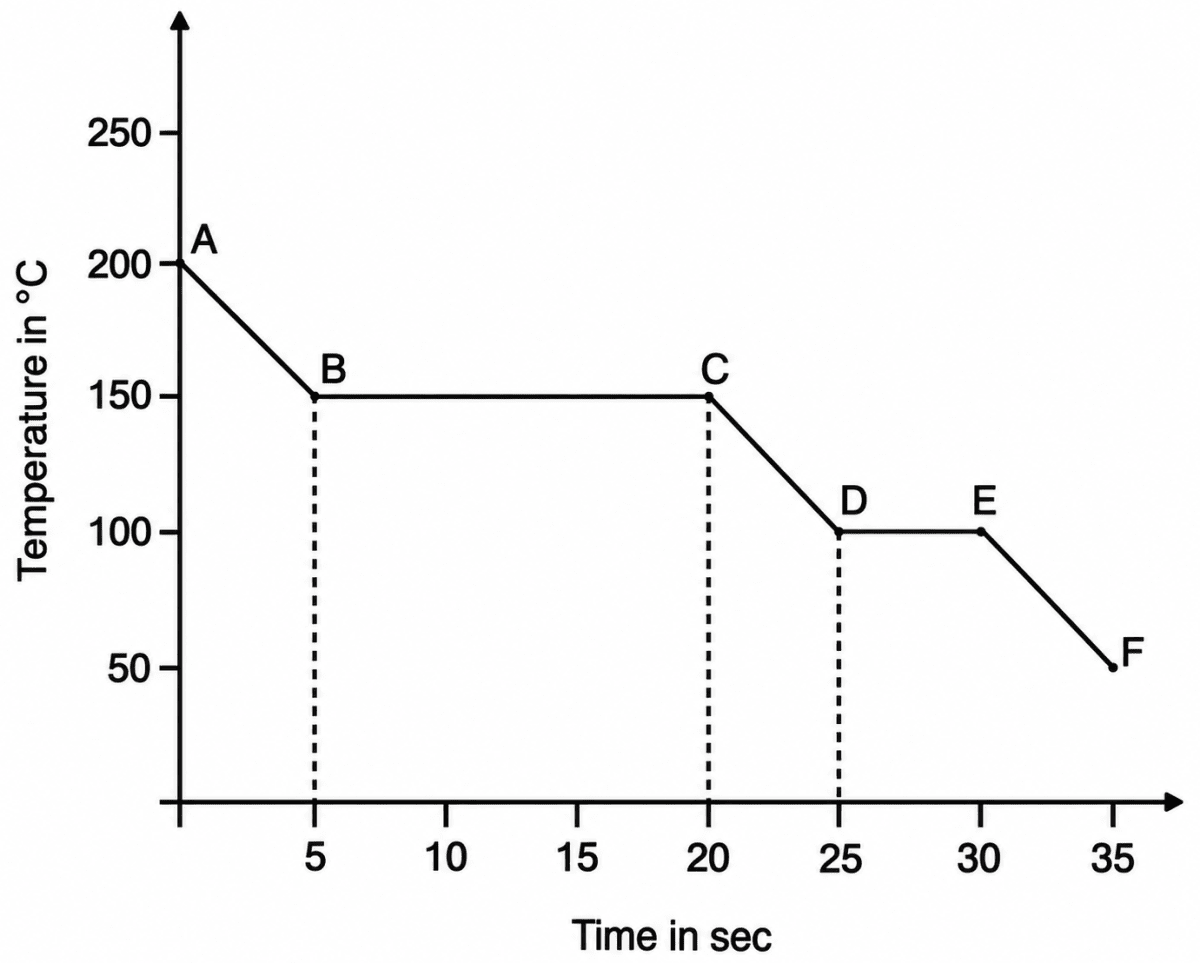
(a) State the boiling point of the substance.
(b) What is the phase change occurring in the region DE?
(c) State the range of temperature during which the substance is in liquid state.
Show SolutionHide Solution↓
(a) The temperature remains constant at 150 °C along the portion BC of the graph, during which the substance condenses from vapour to liquid.
Hence, the boiling point of the substance is 150 °C.
(b) Along DE the temperature remains constant at 100 °C while the substance is still giving out heat. Hence in the region DE the substance changes from the liquid state to the solid state, i.e., it is freezing (solidification).
(c) The substance is completely a liquid from the end of condensation (point C, at 150 °C) up to the beginning of freezing (point D, at 100 °C).
Hence, the substance is in the liquid state in the temperature range 150 °C to 100 °C.