The diagram below shows two graphs showing variation in angle of deviation against angle of incidence for two colours of light (blue, orange) while passing through the same prism. [Diagrams are not drawn to the same scale.]
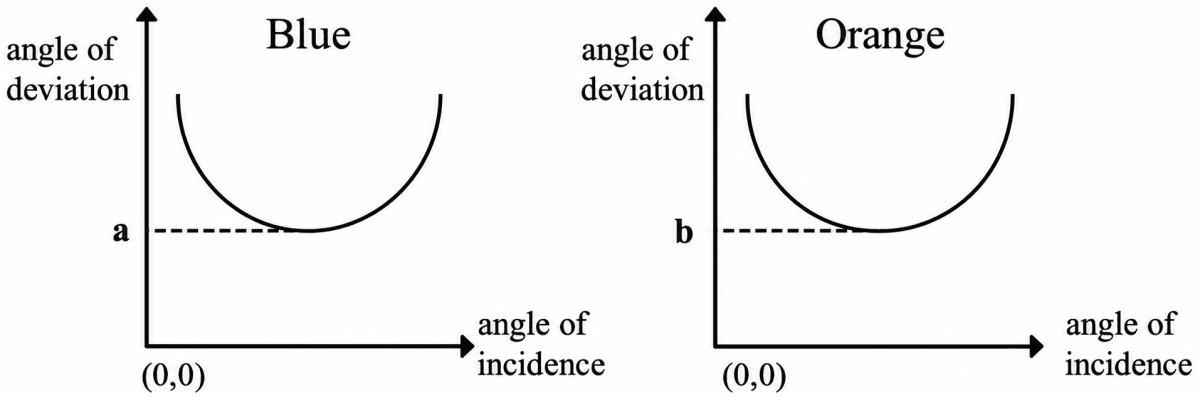
(a) State with a reason whether a = b, a < b, or a > b.
(b) If we increase the angle of the prism then what is the effect on the values of a and b?
Show SolutionHide Solution↓
(a) a > b
Reason — In each graph the lowest point of the curve gives the angle of minimum deviation, so a is the angle of minimum deviation for blue light and b is that for orange light.
The refractive index of the material of a prism decreases with the increase in the wavelength of light. As the wavelength of blue light is smaller than that of orange light, the prism has a greater refractive index for blue light and therefore deviates it more.
Hence, a > b.
(b) The angle of deviation produced by a prism increases with the increase in the angle of the prism.
Hence, on increasing the angle of the prism, the values of both a and b will increase.