1(xviii)
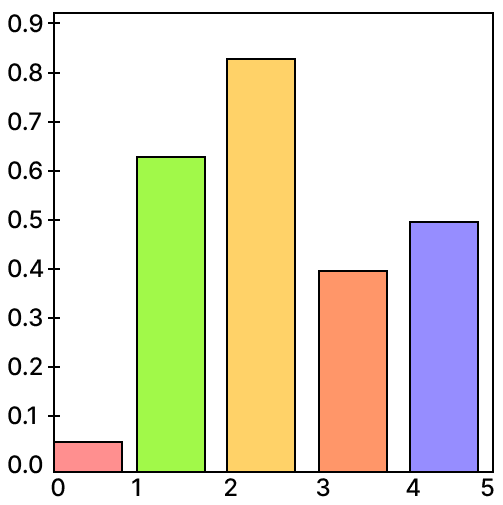
Identify the type of graph shown below.
- (a)Line graph
- (b)Pie plot
- (c)Bar graph
- (d)Scatter plot
Show SolutionHide Solution↓
Bar graph
Reason — The given figure represents a bar graph, where data values are shown using rectangular bars of equal width, and the height of each bar corresponds to the value of the data.