1(xvii)
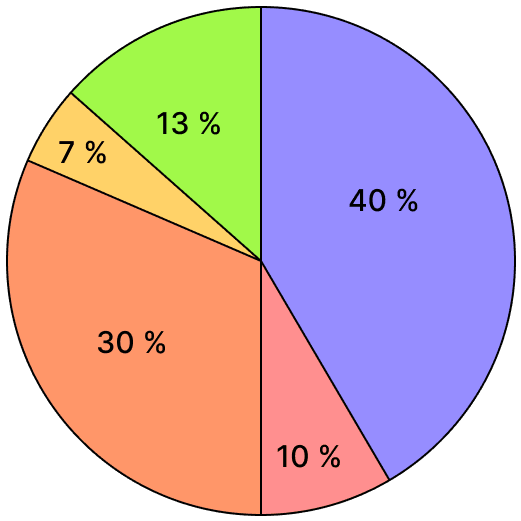
What type of graph is shown in the image?
- (a)Line graph
- (b)Bar graph
- (c)Pie chart
- (d)Scatter plot
Show SolutionHide Solution↓
Pie chart
Reason — A pie chart represents data as slices of a circle, where each slice shows the proportion of a category relative to the whole.